Display Statistic |
  
|
Display Statistic |
|
If you request the statistics service within the eXite® platform, you will see the following operating figures:
•Inbox:
▪# bytes IN – total: Total quantity of received data in bytes
▪# bytes IN – gateway: Quantity of received bytes via gateways
▪IC IN – total: Total quantity of received interchanges
▪IC IN – gateway: Quantity of received interchanges via gateways
•Outbox:
▪# bytes OUT – total: Total quantity of transmitted bytes
▪# bytes OUT – gateway: Quantity of transmitted bytes via gateways
▪IC OUT – total: Total quantity of transmitted interchanges
▪IC OUT - gateway: Quantity of transmitted interchanges via gateways
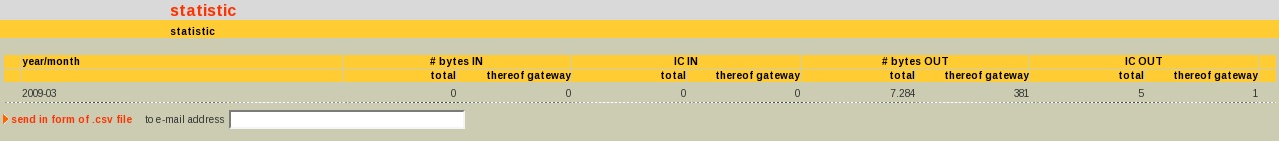
Statistics can be either viewed with a web browser or CSV-file, which is send via e-mail to the declared e-mail address. The received file can be stored and handled with an application e.g. Microsoft Excel. Statistics about the mailbox usage, which are sent as CSV-file, give an overview about the following operating figures:
•Mailbox-ID: Identification of the mailbox
•Mailbox Name: Name of the mailbox
•YYYYMM: Period (month) in which the data has been generated
•Tot. ICs IN: Total quantity of received interchanges
•Tot. Bytes IN: Total quantity of received data in bytes
•ICs INGateway: Quantity of received interchanges via gateways
•Bytes INGateway: Quantity of received bytes via gateways
•Tot ICs OUT: Total quantity of transmitted interchanges
•Tot Bytes OUT: Total quantity of transmitted data in bytes
•ICs OUTGateway: Quantity of transmitted interchanges via gateways
•Bytes OUTGateway: Quantity of transmitted bytes via gateways